Following an accident-prone start to the year (once my wife had almost recovered, one of my sons was hit by a car), we are all going on vacation. The unscathed part of the family will try a week of skiing, hopefully without another visit to the hospital.
In turn, I wont be blogging for the next 10 days or so.
Friday, March 26, 2010
Tuesday, March 23, 2010
Rates Strategy Update: Winds of change
On Mar 9 I proposed a neutral tactical outlook with a bullish tilt but at the same time confirmed that I expect Q2 to be a tough quarter for international bond markets (see Rates Strategy Update: Temporarily back to neutral). I now downgrade both, the tactical and strategic outlook (with a 3months horizon) to bearish.
There are several reasons for this change:
a) bond market seasonality: as written in detail last week (see A look at bond market seasonality dated March 15), especially April historically provides strong headwinds for bond markets.
b) the weather pattern: Winter was severe in the US and large parts of the Eurozone with heavy snowstorms. A strong winter goes hand in hand with weaker retails sales, weaker housing sales and construction. Furthermore, severe winter storms had a temporarily significant impact on traffic. In turn, economic momentum for the December-February period should have been weaker than the underlying trend implies. However, the weather is not responsible for the underlying trend and as the weather normalises, economic momentum should improve again and temporarily be above the underlying trend (as parts of the loss in retails sales/housing market turnover should not be permanent but just have been delayed, i.e. there should be some pent-up demand which will be released once weather conditions have normalised again).
I previously showed a very profitable trading model based on the prevailing temperature for a given month vs. a multi-year average. The temperature is measured in so-called Heating Degree Days (and Cooling Degree Days for the summer months), a population weighted measure for the average temperature prevailing in the US. The model enters a receiving position in the USD 10y swap rate in a month following a colder-than-usual winter month (and warmer than usual summer month) and a paying position otherwise. For more details see for example Here Comes the Weatherman II).
However, there is also a good correlation between the HDD deviation from norm (with a positive number meaning that it is colder than usual and vice versa) and the Chicago Fed National Activity Indicator (the index is a weighted average of 85 indicators of economic activity and seen as a co-incident indicator) as the table below shows.
November - which had unusually cold weather - saw a sharp rise in the CFNAI. However, the cold December and the cold February saw much lower levels of the CFNAI. January - with a close to average temperature - saw a temporary spike in the CFNAI.
However, if we look at weekly HDD data, the temperature prevailing in the US has turned warmer again earlier this month:
Overall, March has been warmer than usual so far. If that is not reversed by the end of the month, then the weather would become clearly bond market negative.
c) the end of the Fed's mortage bond buying programme: The Fed will end its bond buying programme at the end of this month. The programme totalled USD 1.25trn and helped bringing mortgage rates lower. As this happened, other potential buyers of such product were looking for yield elsewhere and helped bring credit yields lower. Furthermore, the average duration of mortgage related securities (given that they have a prepayment option embedded) was reduced and likely fuelled a wave of convexity hedging (via receiving in swaps and to a lesser extent also buying of UST). This should have been a factor explaining the tightening in USD 10y swap spreads as the chart below tries to show (it shows the 10y USD swapspread and the Mortgage Bankers 15y fixed rate mortgage yield).
 Source: Bloomberg
However, as the massive buying ends while on the other side the supply of bonds will remain, it is likely that MBS yields will have to rise to find new buyers. With that the duration increases again and convexity hedging might move the other way, i.e. into a swap paying position. This should also take swap rates and swap spreads higher again and also exert a rising pressure on US Treasury yields.
d) Technicals: On daily charts, the technical situation in 10y Bunds starts to look overbought. Furthermore, while the previous rallies were accompanied by rising volumes and the setbacks by falling volumes, the latest rally saw volumes declining further in both the 10y Bund future (see chart below) as well as the 10y TNote future. This suggests a changing trading behaviour and puts the latest rally on a weaker footing.
 Source: Bloomberg
Overall, this suggests that the current rally in bond prices is likely to end soon and should give way to a markedly negative trading environment with a likely significant rise in yields on an end-Q2 view. In light of this, I downgrade my strategic call from neutral to bearish (looking to re-enter longs around the end of Q2) and also change my tactical outlook from neutral with a bullish tilt to outright bearish. UST yields seem more at risk than their Eurozone core counterparts and I expect UST-Bund spreads to continue on their widening path.
There are several reasons for this change:
a) bond market seasonality: as written in detail last week (see A look at bond market seasonality dated March 15), especially April historically provides strong headwinds for bond markets.
b) the weather pattern: Winter was severe in the US and large parts of the Eurozone with heavy snowstorms. A strong winter goes hand in hand with weaker retails sales, weaker housing sales and construction. Furthermore, severe winter storms had a temporarily significant impact on traffic. In turn, economic momentum for the December-February period should have been weaker than the underlying trend implies. However, the weather is not responsible for the underlying trend and as the weather normalises, economic momentum should improve again and temporarily be above the underlying trend (as parts of the loss in retails sales/housing market turnover should not be permanent but just have been delayed, i.e. there should be some pent-up demand which will be released once weather conditions have normalised again).
I previously showed a very profitable trading model based on the prevailing temperature for a given month vs. a multi-year average. The temperature is measured in so-called Heating Degree Days (and Cooling Degree Days for the summer months), a population weighted measure for the average temperature prevailing in the US. The model enters a receiving position in the USD 10y swap rate in a month following a colder-than-usual winter month (and warmer than usual summer month) and a paying position otherwise. For more details see for example Here Comes the Weatherman II).
However, there is also a good correlation between the HDD deviation from norm (with a positive number meaning that it is colder than usual and vice versa) and the Chicago Fed National Activity Indicator (the index is a weighted average of 85 indicators of economic activity and seen as a co-incident indicator) as the table below shows.
| | HDD deviation from norm | CFNAI |
| October | 49 | -0.90 |
| November | -97 | +0.14 |
| December | 50 | -0.50 |
| January | 14 | -0.04 |
| February | 78 | -0.64 |
November - which had unusually cold weather - saw a sharp rise in the CFNAI. However, the cold December and the cold February saw much lower levels of the CFNAI. January - with a close to average temperature - saw a temporary spike in the CFNAI.
However, if we look at weekly HDD data, the temperature prevailing in the US has turned warmer again earlier this month:
| Week Ending | HDD deviation from norm |
| 02. Jan 10 | 19 |
| 09. Jan 10 | 49 |
| 16. Jan 10 | 2 |
| 23. Jan 10 | -44 |
| 30. Jan 10 | -7 |
| 06. Feb 10 | 11 |
| 13. Feb 10 | 34 |
| 20. Feb 10 | 16 |
| 27. Feb 10 | 20 |
| 06. Mrz 10 | 15 |
| 13. Mrz 10 | -24 |
| 20. Mrz 10 | -28 |
c) the end of the Fed's mortage bond buying programme: The Fed will end its bond buying programme at the end of this month. The programme totalled USD 1.25trn and helped bringing mortgage rates lower. As this happened, other potential buyers of such product were looking for yield elsewhere and helped bring credit yields lower. Furthermore, the average duration of mortgage related securities (given that they have a prepayment option embedded) was reduced and likely fuelled a wave of convexity hedging (via receiving in swaps and to a lesser extent also buying of UST). This should have been a factor explaining the tightening in USD 10y swap spreads as the chart below tries to show (it shows the 10y USD swapspread and the Mortgage Bankers 15y fixed rate mortgage yield).
10y US Swapspread and 15y fixed rate mortgage show high correlation
 Source: Bloomberg
d) Technicals: On daily charts, the technical situation in 10y Bunds starts to look overbought. Furthermore, while the previous rallies were accompanied by rising volumes and the setbacks by falling volumes, the latest rally saw volumes declining further in both the 10y Bund future (see chart below) as well as the 10y TNote future. This suggests a changing trading behaviour and puts the latest rally on a weaker footing.
10y Bund future and volume: latest rally is not accompanied by rising volume anymore
 Source: Bloomberg
Overall, this suggests that the current rally in bond prices is likely to end soon and should give way to a markedly negative trading environment with a likely significant rise in yields on an end-Q2 view. In light of this, I downgrade my strategic call from neutral to bearish (looking to re-enter longs around the end of Q2) and also change my tactical outlook from neutral with a bullish tilt to outright bearish. UST yields seem more at risk than their Eurozone core counterparts and I expect UST-Bund spreads to continue on their widening path.
Monday, March 15, 2010
A look at bond market seasonality
Currently I have a neutral tactical call with a bullish tilt (see Temporarily back to neutral dated March 9) and a neutral strategic duration call. However, my view is that Q2 will be difficult for international bond markets amid a temporary re-acceleration in growth following a severe winter. Furthermore, bond market seasonality has its strongest negative effects in April, a topic I will explore on below.
When looking at bond market seasonality, several issues arise:
- seasonality studies need a long time history in order to make the results somewhat statistically meaningful (even if one uses 20 years of data, that still gives only 20 data points per month)
- benchmark bond yield histories face the drawback that the underlying benchmarks change over time which distorts the yield history
- bond yields can trend for decades but in a seasonality study one does not want such trends to influence the outcome (for example bond yields have been in a bear-trend over the past 25 years).
One time series which offers itself for a seasonality study are the constant maturity treasury yields (CMT) as provided by the St.Louis Federal Reserve. They go back to 1962. Firstly, this provides a longer than usual time series (49 years of data which, however, is still not that much). Secondly, given that they are CMT yields, they do not suffer from benchmark changes. Thirdly, in 1962 10y CMT were at approx. 4%, i.e. not far away from the current level of around 3.70%.
The chart below shows the average change in basispoints during the various months. In addition, it shows the net number of months during which yields rose in between 1962-2009. As can be seen, during this time period yields rose on average from January to May and fell thereafter until year end. Furthermore, this was not achieved by some outlier months with huge yield changes but rather by a significant larger number of months seeing yield rises than yield falls (from Jan-May) and vice versa especially in June and from September-December.
 Source: St. Louis Federal Reserve, Research Ahead
To better highlight this seasonality, the chart below shows the p&l from being short bonds from Jan-May and from being long bonds from June-December. As can be expected from the average yield changes, both, the short and the long trade produce significant profits over this time period. What is more, while the long trade only really starts to perform from the early 1980s onwards (i.e. once the structural bond bull-market sets in), the short trade performed during both, the bear-market of the 1970s and more importantly the bull-market of the 80s/90s and 00s.
 Source: Research Ahead
In order to test for a different behaviour during the Great bull and bear markets, I divided the history in two sub-segments from 1962-1981 (when the yield high was reached) and from 1982 to 2009. The table below shows the average yield changes during both sub-periods. It is interesting to note, that during the bear market, yields on average rose almost throughout the year (except during November) with the largest yield rises in January, February and July. During the bull market, however, the dispersion of average yield changes was much wider (26bp vs. 13bp) and yields fell on average only during 6 months (June and August-December).
Average monthly change during the Great bear market and the Great bull market
Source: Research Ahead
Furthermore, while during the bear market, the average rise in yields in January and February was larger than during the bear market, the average rise in yields for March and April was much higher in the bull market than previously.
Now, if we do not know whether we are in a structural bull or bear market and the above pattern still holds, this would suggest that shorts are most preferable in March and especially April while longs seem to be advisable especially in November. But it also suggests that even if one assumes that the bond bull market has not ended, being invested early in the year does not pay on average and one should be more active in H2 of any given year.
While I do not advise to invest purely on historical seasonal patterns, it supports my stance that Q2 might be a difficult quarter for international bond markets.
When looking at bond market seasonality, several issues arise:
- seasonality studies need a long time history in order to make the results somewhat statistically meaningful (even if one uses 20 years of data, that still gives only 20 data points per month)
- benchmark bond yield histories face the drawback that the underlying benchmarks change over time which distorts the yield history
- bond yields can trend for decades but in a seasonality study one does not want such trends to influence the outcome (for example bond yields have been in a bear-trend over the past 25 years).
One time series which offers itself for a seasonality study are the constant maturity treasury yields (CMT) as provided by the St.Louis Federal Reserve. They go back to 1962. Firstly, this provides a longer than usual time series (49 years of data which, however, is still not that much). Secondly, given that they are CMT yields, they do not suffer from benchmark changes. Thirdly, in 1962 10y CMT were at approx. 4%, i.e. not far away from the current level of around 3.70%.
The chart below shows the average change in basispoints during the various months. In addition, it shows the net number of months during which yields rose in between 1962-2009. As can be seen, during this time period yields rose on average from January to May and fell thereafter until year end. Furthermore, this was not achieved by some outlier months with huge yield changes but rather by a significant larger number of months seeing yield rises than yield falls (from Jan-May) and vice versa especially in June and from September-December.
Strong seasonality in the US 10y CMT rate from 1962-2009
 Source: St. Louis Federal Reserve, Research Ahead
To better highlight this seasonality, the chart below shows the p&l from being short bonds from Jan-May and from being long bonds from June-December. As can be expected from the average yield changes, both, the short and the long trade produce significant profits over this time period. What is more, while the long trade only really starts to perform from the early 1980s onwards (i.e. once the structural bond bull-market sets in), the short trade performed during both, the bear-market of the 1970s and more importantly the bull-market of the 80s/90s and 00s.
A bond-bearish move until May seems to be a feature of a bull as well as a bear market
 Source: Research Ahead
Average monthly change during the Great bear market and the Great bull market
| Month | Jan62-Dec81 | Jan82-Dec09 |
| January | 8 | 2 |
| February | 9 | 1 |
| March | 1 | 8 |
| April | 3 | 13 |
| May | 2 | 0 |
| June | 2 | -5 |
| July | 9 | 0 |
| August | 5 | -9 |
| September | 3 | -11 |
| October | 6 | -13 |
| November | -4 | -11 |
| December | 2 | -4 |
Furthermore, while during the bear market, the average rise in yields in January and February was larger than during the bear market, the average rise in yields for March and April was much higher in the bull market than previously.
Now, if we do not know whether we are in a structural bull or bear market and the above pattern still holds, this would suggest that shorts are most preferable in March and especially April while longs seem to be advisable especially in November. But it also suggests that even if one assumes that the bond bull market has not ended, being invested early in the year does not pay on average and one should be more active in H2 of any given year.
While I do not advise to invest purely on historical seasonal patterns, it supports my stance that Q2 might be a difficult quarter for international bond markets.
Tuesday, March 9, 2010
Rates Strategy Update: Temporarily back to neutral
I adopted a neutral strategic outlook and a negative tactical outlook on Feb 18(see: Rising risks of a rise in yields). While initially bond yields rose (on the back of the discount rate hike in the US), they have fallen back subsequently and are currently some 10bp lower. I continue to expect especially April and May to provide a challenging environment for government bonds with a likely significant rise in yields into mid-year. Reasons are the adverse winter weather which led to a more pronounced seasonal downswing in economic activity, but should be followed by a more pronounced upswing later on. Furthermore, April and May are usually the cruellest months for bond investors (I will write more on both at a later stage). Finally, while government bond supply will continue unabated, the US Fed's buying of MBS is drawing to an end at the end of this month.
Therefore, I continue to see a pronounced risk of a significant rise in yields over the next months. However, over the next 2-3 weeks, the balance of risk is favouring a different view and I therefore adopt a neutral tactical outlook with a bullish tilt, looking to re-enter shorts at a later stage.
A) Positioning: Short positions have been reduced somewhat since the extremes reached in mid-January. However, they still do not seem to be at a level which historically has been associated with a significant move higher in yields. The chart below shows the aggregated positioning by non-commercial accounts in the US 2y, 5y, 10y & 30y futures (weighted by the respective pvbp of the futures contract). The last data point relating to March 2nd is marked in red.
 Source: CFTC, Research Ahead
b) The weather: I have written several times on this subject (see for example: Here Comes the Weatherman II dated Feb 25). Unfortunately, the weather has remained colder than is usually the case going into March. The table below shows the population weighted heating degree days (HDD) per week for the US as well as the deviation from the historic norm for that week. A positive deviation means that there were more heating degree days and in turn the average weather was colder than is usually the case.
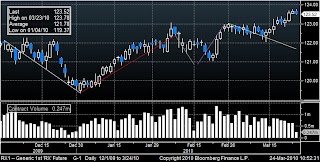
c) Technicals: So far the technical picture does not provide a sell signal. While bond markets were overbought in the midst of February when I suggested a tactical short, this situation has corrected in the meantime and I would consider technicals as largely being neutral with a bullish tilt as the bullish trends in the 10y UST and Bund future contracts remain in place. The chart below tries to highlight this situation for the 10y US future. The bearish trend-line which was about to be formed by the highs reached in late November and early February was broken to the upside whereas the two upward slopinng trendlines (one since July last year and one in place since the start of this year) are still in place.
 Source: Bloomberg
Overall, I still look for a potentially significant rise in yields during April/May and stick to a neutral strategic view. However, the next 2-3 weeks might rather see a temporary move lower in both, US and Eurozone yields. In turn, I change my tactical outlook from negative to neutral with a bullish tilt, looking to re-enter shorts at a later stage.
Therefore, I continue to see a pronounced risk of a significant rise in yields over the next months. However, over the next 2-3 weeks, the balance of risk is favouring a different view and I therefore adopt a neutral tactical outlook with a bullish tilt, looking to re-enter shorts at a later stage.
A) Positioning: Short positions have been reduced somewhat since the extremes reached in mid-January. However, they still do not seem to be at a level which historically has been associated with a significant move higher in yields. The chart below shows the aggregated positioning by non-commercial accounts in the US 2y, 5y, 10y & 30y futures (weighted by the respective pvbp of the futures contract). The last data point relating to March 2nd is marked in red.
Aggregated positioning by non-commercial accounts in US bond futures
 Source: CFTC, Research Ahead
b) The weather: I have written several times on this subject (see for example: Here Comes the Weatherman II dated Feb 25). Unfortunately, the weather has remained colder than is usually the case going into March. The table below shows the population weighted heating degree days (HDD) per week for the US as well as the deviation from the historic norm for that week. A positive deviation means that there were more heating degree days and in turn the average weather was colder than is usually the case.
| Week ending | Heating Degree Days | Deviation from norm |
| 02. Jan 10 | 222 | 19 |
| 09. Jan 10 | 256 | 49 |
| 16. Jan 10 | 211 | 2 |
| 23. Jan 10 | 164 | -44 |
| 30. Jan 10 | 198 | -7 |
| 06. Feb 10 | 210 | 11 |
| 13. Feb 10 | 225 | 34 |
| 20. Feb 10 | 196 | 16 |
| 27. Feb 10 | 188 | 20 |
| 06. Mrz 10 | 172 | 15 |
Source: NOAA
The year started colder than usual with a milder period in the second half of January. Thereafter, the weather turned colder again and has remained so for the past five weeks. Again as a reminder a stronger-than-usual winter should be especially bad for retails sales, construction activity & home sales. Given that it seems to last well into March and March is usually a month with a high seasonal acceleration in economic activity, the seasonally adjusted data for early March promise to turn out relatively weak. In turn, bond markets are likely to remain supported for the next 2-3 weeks.
c) Technicals: So far the technical picture does not provide a sell signal. While bond markets were overbought in the midst of February when I suggested a tactical short, this situation has corrected in the meantime and I would consider technicals as largely being neutral with a bullish tilt as the bullish trends in the 10y UST and Bund future contracts remain in place. The chart below tries to highlight this situation for the 10y US future. The bearish trend-line which was about to be formed by the highs reached in late November and early February was broken to the upside whereas the two upward slopinng trendlines (one since July last year and one in place since the start of this year) are still in place.
10y US Treasury future still guided by upward sloping trend
 Source: Bloomberg
Monday, March 8, 2010
A European Monetary Fund?
The discussion about installing a European Monetary Fund (EMF) seems to gather speed. Not only has Thomas Mayer together with Daniel Gross proposed an EMF erlier this year (see here for their original paper), but also the German Finance Minister Schaeuble has argued in the same direction over the weekend and now as Bloomberg reports, the EU Commission seems to be ready to propose an EMF-type instrument. As reported, the proposal should be ready by June. This highlights that the political will to continue with the European integration project remains strong.
Such an EMF - depending on how it is done - could go a long way in addressing some of the shortcomings of the Eurozone (it is frequently stated that no currency union has survived without a fiscal union).
The stability and growth pact tried to partially correct for some of the shortcomings in establishing limits on debt and deficits. The hope was that the SGP would force a sustainable path for the sovereign sector and in turn there would never arise a situation where a sovereign would risk bankruptcy and/or be in need of member-states' bailout money. However, even before the SGP was dramatically weakened it failed to enforce fiscal sustainability.
An EMF - besides acting as a lender of last resort - could provide stronger incentives to promote fiscal sustainability in the first place. For one, Gross and Mayer propose that the EMF would be financed by a fee based on the fiscal deficit exceeding 3% and on the sovereign debt exceeding 60% of GDP. Finally, the EMF would also manage an orderly default of a member state.
Such an EMF for the Eurozone would clearly strengthen its institutional set-up and render it more resilient against shocks via a) the promotion of fiscal sustainability during good times and b) the support provided during a crises.
I personally am clearly in favour of such an EMF, even though it might take a long time to set it up and even though the institution which will likely be established will be far from perfect. However, it still cannot account for the fact that the Eurozone is not an optimal currency area and especially labour mobility between countries remains relatively low. Asymmetric shocks in such a set-up will continue to hit member states again and again.
Tuesday, March 2, 2010
Should the Inflation Target Be Raised?
The discussion about the right structural inflation level to be targeted by central banks has resurfaced. Most notably Olivier Blanchard, head of the research department at the IMF, has proposed that inflation targets should be raised from around 2% at present to 4% in order to reduce the economic costs associated with hitting the zero nominal bound. He makes his case in a paper entitled Rethinking Macroeconomic Policy and in a shorter-version interview (see here). His main argument is that with a somewhat higher inflation rate, central banks could have slashed rates more during the financial crisis before hitting the zero lower bound.
Blanchard is not alone in calling for a higher inflation target and for example Prof. Krugman supports higher inflation targets (see The case for Higher Inflation Inflation) where he adds that: "... even in the long run, it’s really, really hard to cut nominal wages. Yet when you have very low inflation, getting relative wages right would require that a significant number of workers take wage cuts. So having a somewhat higher inflation rate would lead to lower unemployment, not just temporarily, but on a sustained basis."
In turn, the problems associated with the zero lower bound as well as the distortions emanating from certain prices being difficult to reduce in nominal terms (I would also add that this does not only apply to wages but also to other prices as for example it is difficult to lower rents in nominal terms unless the renters move), create costs if inflation falls too low or becomes negative.
On the other side, there are various costs emanating from higher inflation:
a) Relative-price distortions: Not all prices inflate at the same rate, and so inflation generates some relative-price distortions which lead to resource misallocation. The higher the inflation rate, the greater these distortions.
b) Stability of inflation expectations: It is much more difficult to have stable inflation expectations at higher levels than at lower ones. In turn, the higher the inflation rate, the larger the danger, that inflation continues to move up ever further.
c) Unexpected inflation: Empirically inflation is also much more volatile at higher rates than at lower rates. In turn, unexpected inflation tends to become a significant problem, the higher the inflation target is. Unexpected inflation also leads to significant ressource misallocation.
A high level of relative price distortions as well as unexpected inflation will directly lead to ressource misallocation. Furthermore, both act to raise long-run risk premia. From a bond market perspective this means a steeper yield curve and in turn higher costs to raise long-maturity funds. From an entrepreneurial perspective it means that long-term business investment proejcts bear a higher risk (it is more difficult to forecast the business environment/cash flows) and a higher cost (again amid higher risk premia incorporated into financial markets). In turn, not only will there be a higher level of ressource misallocation but also the hurlde to carry through long-term investments is higher than in an environment of low unexpected inflation and limited relative price distortions. Both will act to weigh significantly on trend growth.
In turn, we should not be surprised to find a negative relationship between inflation and growth at higher levels. But what level exactly? The IMF itself in a research paper from 2001 (see here) found that: " The threshold level of inflation above which inflation significantly slows growth is estimated at 1–3 percent forindustrial countries and 11–12 percent for developing countries. The negative and significant relationship between inflation and growth, for inflation rates above the threshold level, is quite robust."
As a result, I fail to be convinced that a higher inflation level would provide a more favorable monetary environment for the major economies and think that it would depress trend growth rates resulting in ever increasing costs for society.
Subscribe to:
Posts (Atom)


